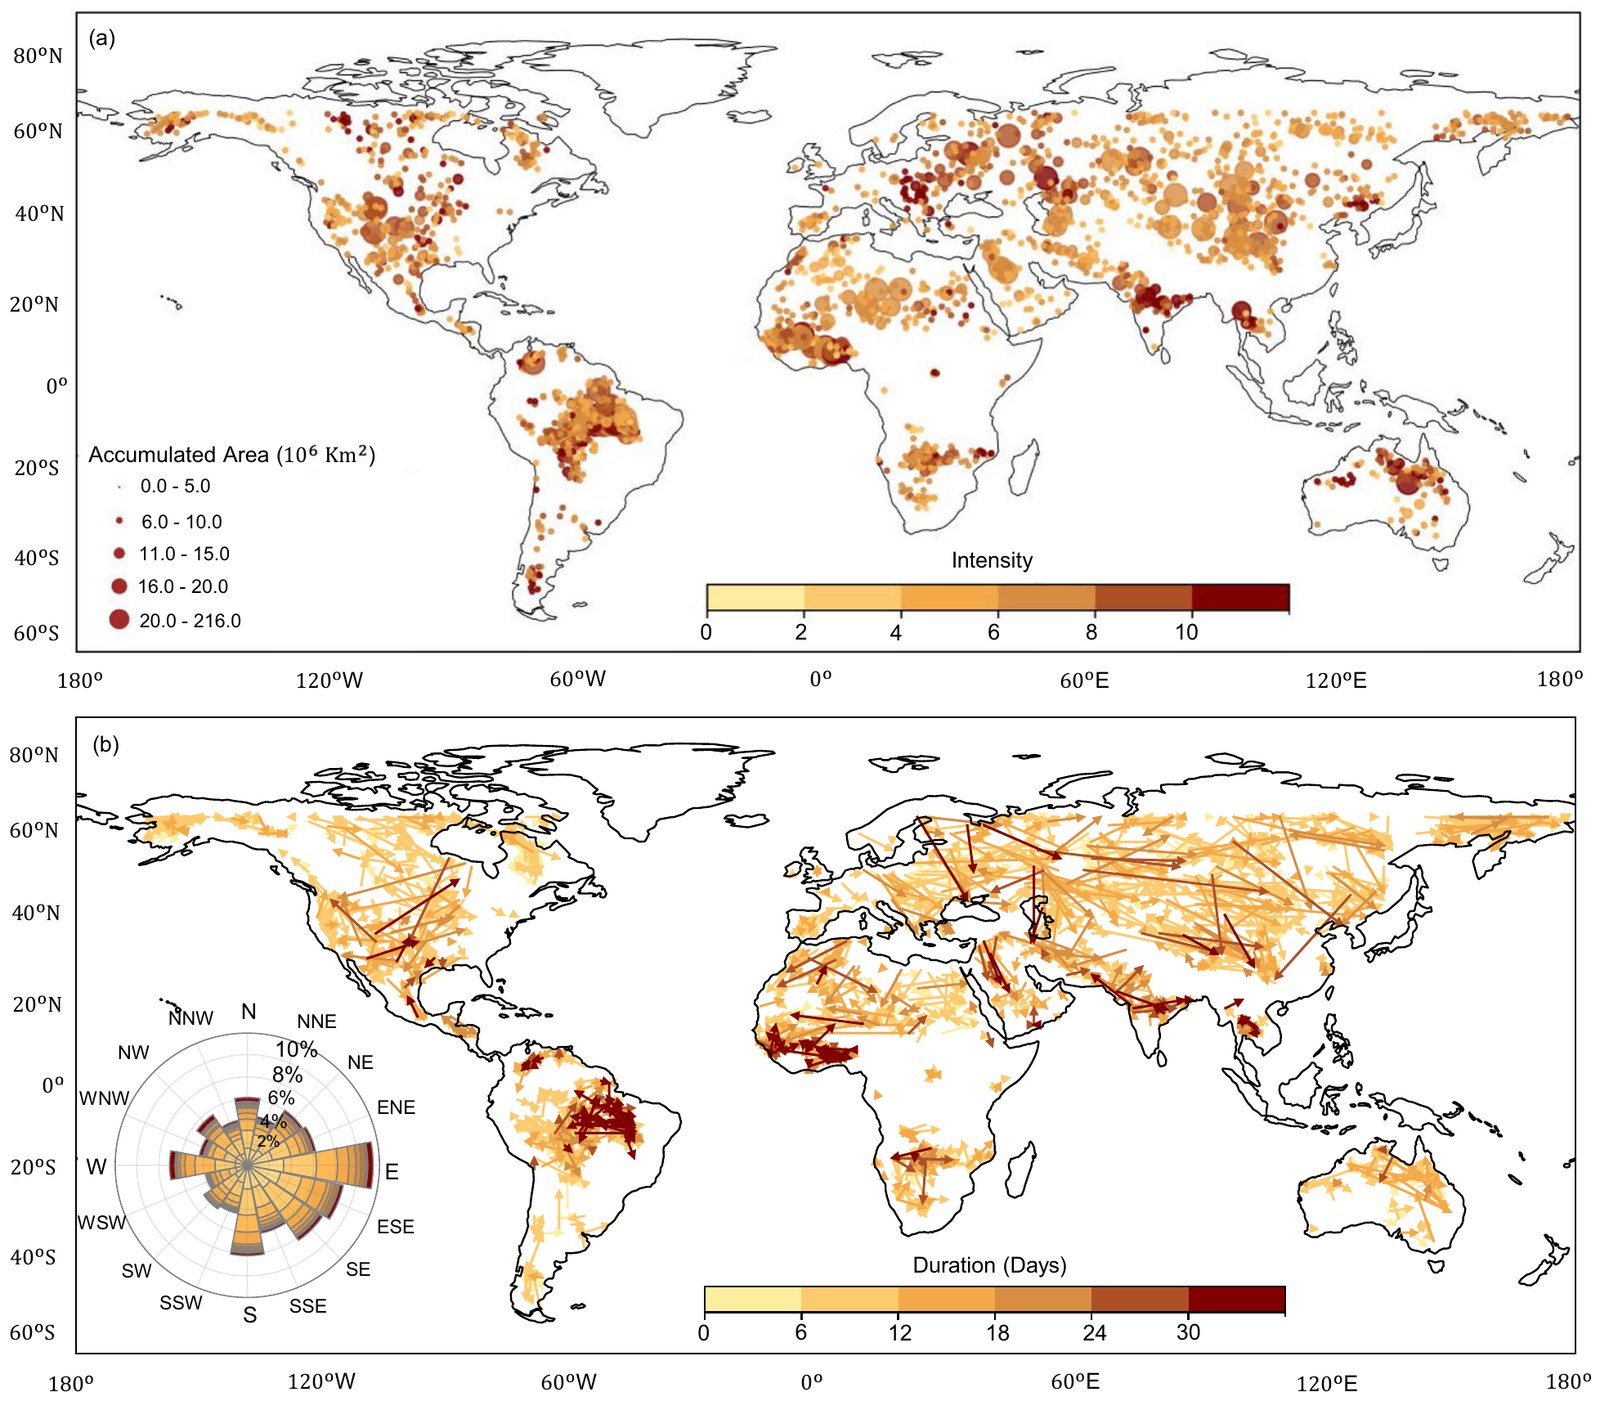
What works
- Two variables on one marker
- Classes instead of continuous scales
- One colour ramp for both panels
- Legends sit in the ocean
- A rose diagram for direction
Draw it yourself
The script below rebuilds these techniques with Matplotlib and Cartopy. The events are synthetic, so the picture shows the method, not the paper’s results.
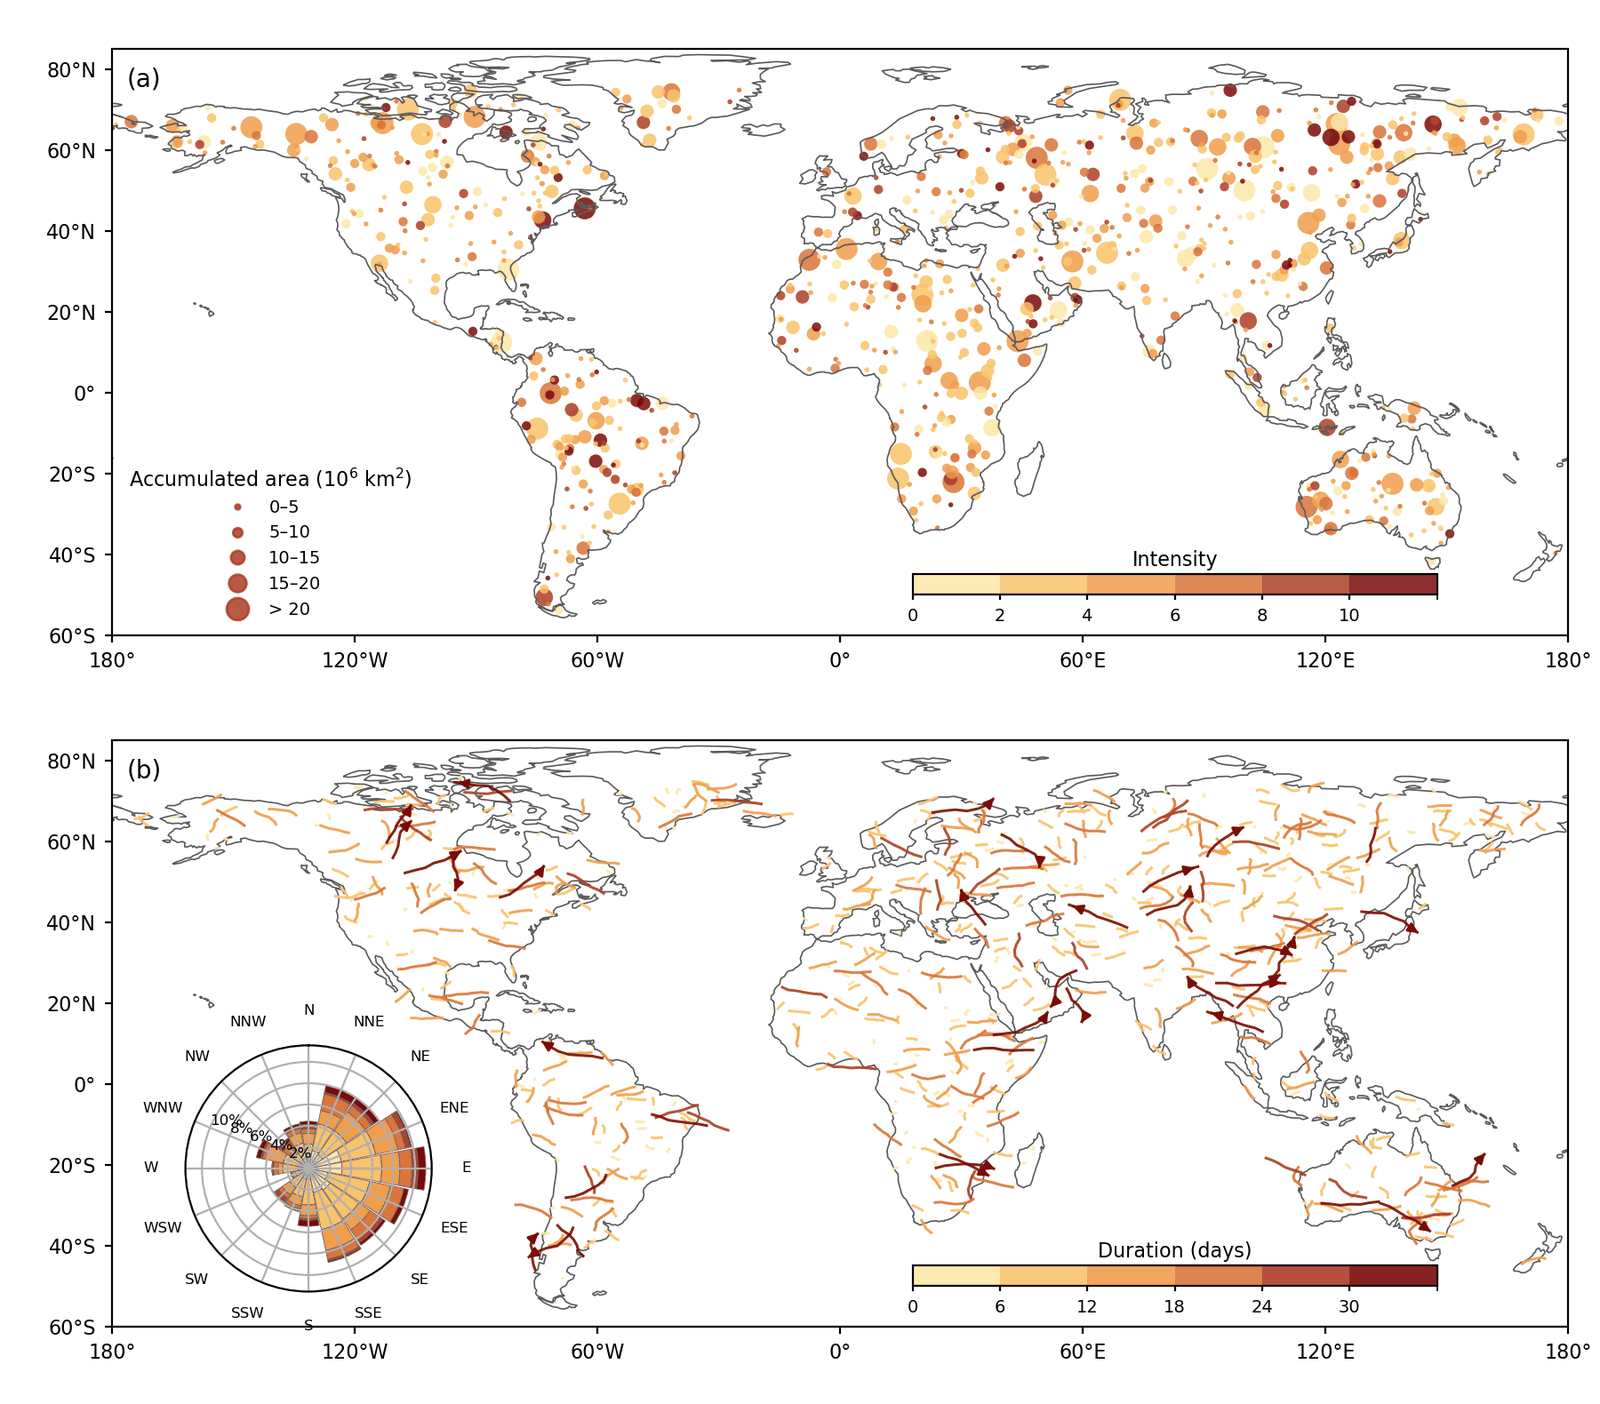
# Bubble map and track map with a rose-diagram inset, in the style of Fig. 1 of
# Sabut et al. (2026, Nature Communications, doi:10.1038/s41467-026-78045-3).
# The events below are synthetic and only illustrate the drawing technique.
import numpy as np
import matplotlib.pyplot as plt
from matplotlib.collections import LineCollection
from matplotlib.colors import BoundaryNorm, ListedColormap
from matplotlib.lines import Line2D
import cartopy.crs as ccrs
import cartopy.io.shapereader as shpreader
from cartopy.mpl.ticker import LatitudeFormatter, LongitudeFormatter
from shapely.geometry import Point
from shapely.ops import unary_union
from shapely.prepared import prep

rng = np.random.default_rng(7)
PC = ccrs.PlateCarree()
RAMP = ['#fde8a8', '#f8c46a', '#f09e4b', '#d9743a', '#ad3d27', '#7a0a0a']

land = prep(unary_union(list(shpreader.Reader(shpreader.natural_earth('110m', 'physical', 'land')).geometries())))


def land_points(n):
    pts = []
    while len(pts) < n:
        lon, lat = rng.uniform(-180, 180), rng.uniform(-55, 75)
        if land.contains(Point(lon, lat)):
            pts.append((lon, lat))
    return np.array(pts)


def base_map(ax, label):
    ax.set_extent([-180, 180, -60, 85], crs=PC)
    ax.coastlines(linewidth=0.6, color='0.35')
    ax.set_xticks(np.arange(-180, 181, 60), crs=PC)
    ax.set_yticks(np.arange(-60, 81, 20), crs=PC)
    ax.xaxis.set_major_formatter(LongitudeFormatter())
    ax.yaxis.set_major_formatter(LatitudeFormatter())
    ax.tick_params(labelsize=8, length=3)
    ax.text(0.01, 0.97, label, transform=ax.transAxes, va='top', fontsize=10)


def inset_colorbar(fig, ax, mappable, ticks, title):
    cax = ax.inset_axes([0.55, 0.07, 0.36, 0.035])
    cb = fig.colorbar(mappable, cax=cax, orientation='horizontal', ticks=ticks)
    cb.ax.tick_params(labelsize=7, length=2)
    cb.ax.set_title(title, fontsize=8, pad=3)


fig = plt.figure(figsize=(9, 7.9))
ax1 = fig.add_subplot(2, 1, 1, projection=PC)
ax2 = fig.add_subplot(2, 1, 2, projection=PC)

# (a) Two variables on one marker: size shows area, colour shows intensity.
centres = land_points(900)
area = rng.lognormal(1.6, 0.8, len(centres))
intensity = np.clip(rng.gamma(2.6, 1.9, len(centres)), 0, 11.9)
size_edges = [0, 5, 10, 15, 20, np.inf]
size_px = np.array([4, 14, 30, 50, 80])
sizes = size_px[np.digitize(area, size_edges[1:-1])]
cmap_i = ListedColormap(RAMP)
norm_i = BoundaryNorm([0, 2, 4, 6, 8, 10, 12], cmap_i.N)
order = np.argsort(sizes)[::-1]
sc = ax1.scatter(centres[order, 0], centres[order, 1], s=sizes[order], c=intensity[order], cmap=cmap_i, norm=norm_i,
                 alpha=0.85, linewidths=0, transform=PC)
base_map(ax1, '(a)')
labels = ['0–5', '5–10', '10–15', '15–20', '> 20']
handles = [Line2D([], [], ls='', marker='o', markersize=np.sqrt(s), color='#ad3d27', alpha=0.85) for s in size_px]
ax1.legend(handles, labels, title='Accumulated area (10$^6$ km$^2$)', loc='lower left', fontsize=7, title_fontsize=8,
           frameon=False, labelspacing=0.5, borderaxespad=0.6)
inset_colorbar(fig, ax1, sc, [0, 2, 4, 6, 8, 10], 'Intensity')

# (b) Tracks coloured by duration, with a rose diagram of travel directions.
starts = land_points(700)
duration = np.clip(rng.gamma(2.0, 6.0, len(starts)), 2, 35.9)
heading = rng.vonmises(0.0, 0.7, len(starts))


def track(x, y, h, days, steps=6):
    step = days * 0.5 / steps
    pts = [(x, y)]
    for _ in range(steps):
        h += rng.normal(0, 0.25)
        x, y = x + step * np.cos(h), y + 0.6 * step * np.sin(h)
        pts.append((x, y))
    return pts


tracks = [track(x, y, h, d) for (x, y), h, d in zip(starts, heading, duration)]
cmap_d = ListedColormap(RAMP)
norm_d = BoundaryNorm([0, 6, 12, 18, 24, 30, 36], cmap_d.N)
order = np.argsort(duration)
lc = LineCollection([tracks[i] for i in order], cmap=cmap_d, norm=norm_d, linewidths=1.1, alpha=0.9, transform=PC)
lc.set_array(duration[order])
ax2.add_collection(lc)
for i in order[-30:]:
    (x0, y0), (x1, y1) = tracks[i][-2], tracks[i][-1]
    ax2.annotate('', xy=(x1, y1), xytext=(x0, y0), xycoords=PC._as_mpl_transform(ax2),
                 arrowprops=dict(arrowstyle='-|>', lw=1.1, color=RAMP[-1], mutation_scale=8))
base_map(ax2, '(b)')
inset_colorbar(fig, ax2, lc, [0, 6, 12, 18, 24, 30], 'Duration (days)')

rose = ax2.inset_axes([0.035, 0.06, 0.2, 0.42], projection='polar')
sectors = 16
width = 2 * np.pi / sectors
compass = (np.pi / 2 - heading) % (2 * np.pi)
sector = np.floor(((compass + width / 2) % (2 * np.pi)) / width).astype(int)
bottom = np.zeros(sectors)
for k in range(cmap_d.N):
    share = np.bincount(sector[np.digitize(duration, norm_d.boundaries[1:-1]) == k], minlength=sectors) / len(duration) * 100
    rose.bar(np.arange(sectors) * width, share, width=width * 0.95, bottom=bottom, color=RAMP[k], edgecolor='0.4', linewidth=0.3)
    bottom += share
rose.set_theta_zero_location('N')
rose.set_theta_direction(-1)
rose.set_xticks(np.arange(sectors) * width)
rose.set_xticklabels(['N', 'NNE', 'NE', 'ENE', 'E', 'ESE', 'SE', 'SSE', 'S', 'SSW', 'SW', 'WSW', 'W', 'WNW', 'NW', 'NNW'], fontsize=6)
rose.set_rlabel_position(292.5)
rose.tick_params(axis='y', labelsize=6)
rose.yaxis.set_major_formatter(lambda v, _: f'{v:.0f}%')
rose.patch.set_alpha(0.9)

fig.subplots_adjust(left=0.07, right=0.98, top=0.98, bottom=0.04, hspace=0.1)
fig.savefig('bubble-and-track-maps.png', dpi=200)